📖
Stake Local Dashboard
  • Stake Local Dashboard
    • Library Sections
  • Dashboard Installation
    • Installation Overview
    • Install Supporting Software
      • Install Prerequisites
      • Install Prometheus
      • Install Grafana
      • Install node_exporter
      • Install json_exporter
      • Install Ethereum Metrics Exporter
    • Configure Ethereum Clients
    • Configure Supporting Software
      • Configure json_exporter
      • Configure Prometheus Rules
      • Configure Ethereum Metrics Exporter
    • Prometheus Jobs & Targets
      • Prometheus Jobs
      • About Stake Local Labels
      • Base Targets Installation
      • Consensus Client Targets
      • Execution Client Targets
      • Validator Client Targets
      • node_exporter Target
      • json_exporter Target
      • Ethereum Metrics Exporter Targets
      • Third-Party Targets
      • Ethereum Address Targets
      • Validator Public Key Targets
      • Optional: Grafana Target
      • Optional: Prometheus Target
      • Clean Up Unused Targets
    • Optional: Alternative Dashboard Compatibility
      • Besu Dashboard Compatibility
      • Erigon Dashboard Compatibility
      • Geth Dashboard Compatibility
      • Lighthouse Dashboard Compatibility
      • Lodestar Dashboard Compatibility
      • Nethermind Dashboard Compatibility
      • Nimbus Dashboard Compatibility
      • Prysm Dashboard Compatibility
      • Teku Compatibility
    • Enable & Start/Restart Services
      • Checking Software Status
    • Install Dashboard
  • Additional Modifications
    • Additional Staking Groups
    • Change or Add Currency
Powered by GitBook
On this page
  • Install Dashboard
  • Login to Grafana
  • Configure Prometheus Data Source
  1. Dashboard Installation

Install Dashboard

Configure Grafana and install the Stake Local Dashboard

PreviousChecking Software StatusNextAdditional Modifications

Last updated 2 years ago

Install Dashboard

Login to Grafana

Login to Grafana at , replacing 127.0.0.1 with the IP address of your Grafana instance.

If this is your first time logging in to Grafana, use the default username admin and the default password admin. Grafana will ask you to set a new password.

Configure Prometheus Data Source

Connect Grafana to your Prometheus instance by configuring the Prometheus Data Source in Grafana.

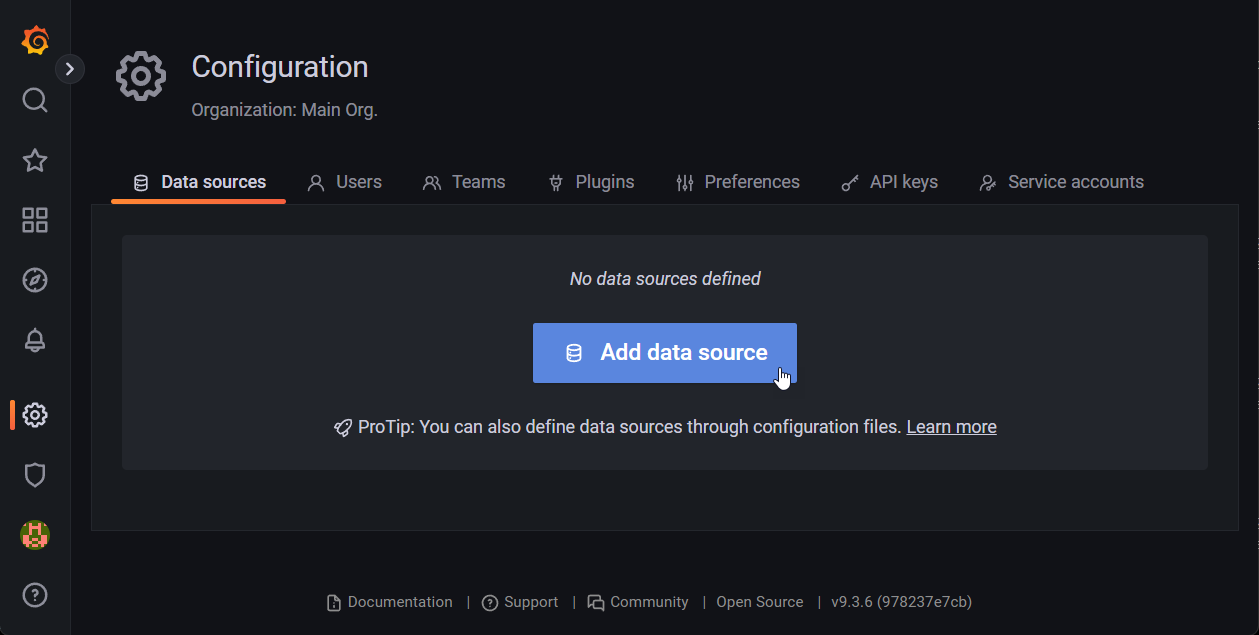
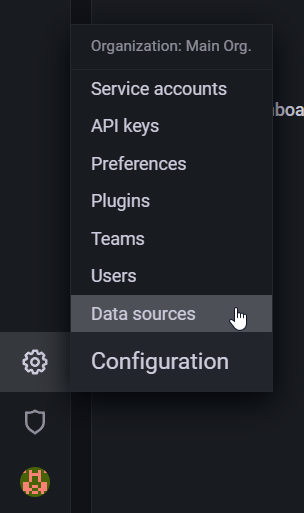
On Grafana's left-hand menu, hover over the gear menu and click on Data Sources.

Then click on the Add Data Source button.

Click on Prometheus under "Time series databases".

Enter http://127.0.0.1:9090/ into the URL field. If your Prometheus instance is accessible at a different IP address or port, update those here. Otherwise, click on the Add Data Source button.

Click Save & Test.

Grafana should report that the data source is working.

Install Grafana Dashboard

Hover over the Dashboards menu in Grafana's left-hand menu, then click on Import.

Copy and paste the dashboard at into the "Import via panel json" text box on the screen.

It is also available in the cloned Stake Local Dashboard GitHub repository at ~/git/stakelocal-dashboard/dashboard/stakelocal-dashboard.json.

cat ~/git/stakelocal-dashboard/dashboard/stakelocal-dashboard.json

Then click the Load button.

Select your Prometheus data source in the Prometheus field.

Optionally change the Currency Code value to one of the supported currencies: USD, EUR, JPY, GPB, AUD, CAD, CHF, CNY, HKD, NZD, ILS, KRW, MXN, RUB, SGD, TWD, or INR.

Click the Import button.

The dashboard should appear and data should begin to populate. Some data may take additional time to populate, from an epoch to two hours.

Congratulations, you have set up the Stake Local Dashboard.

If you used the instructions to change the default Stake Local Prometheus job_name to another value for Lighthouse or Prysm, you must update the job names on this screen. Update the Prysm Beacon Job Name, Prysm Validator Job Name, Lighthouse Beacon Job Name, and Lighthouse Validator Job Name variables to match your new job_name values, if applicable.

Dashboard JSON via GitHub
Optional: Alternative Dashboard Compatibility
http://127.0.0.1:3000/
Select Data Sources
Click on Add Data Source
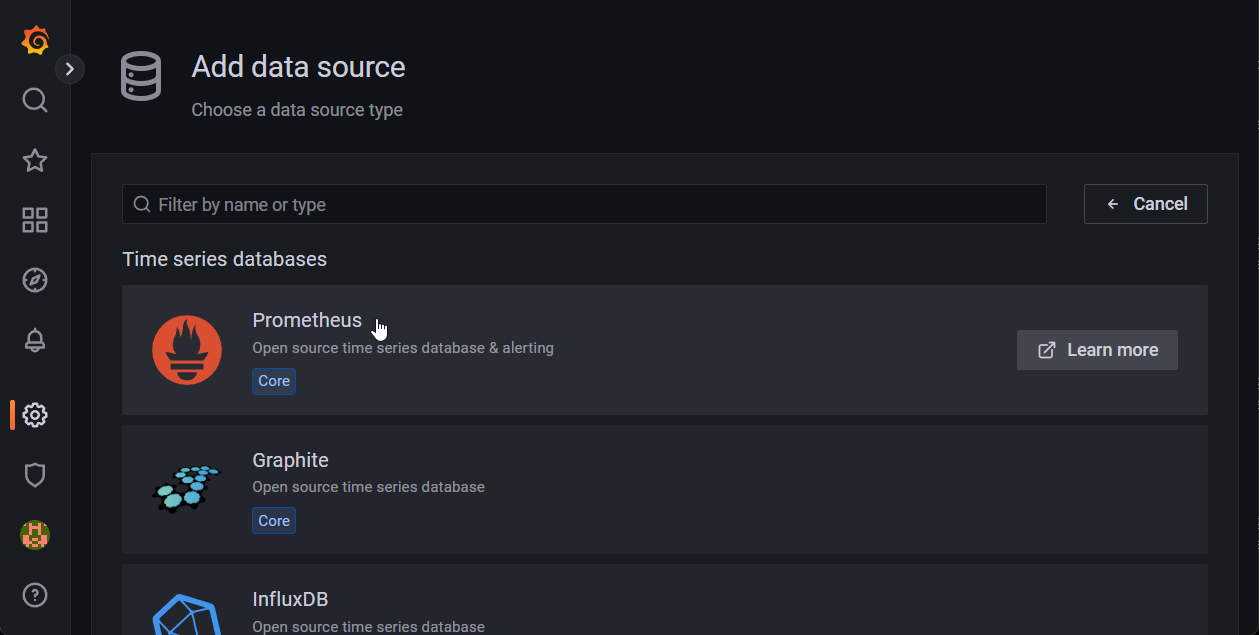
Select the Prometheus panel
Enter the URL to your Prometheus instance
Save and test the connection
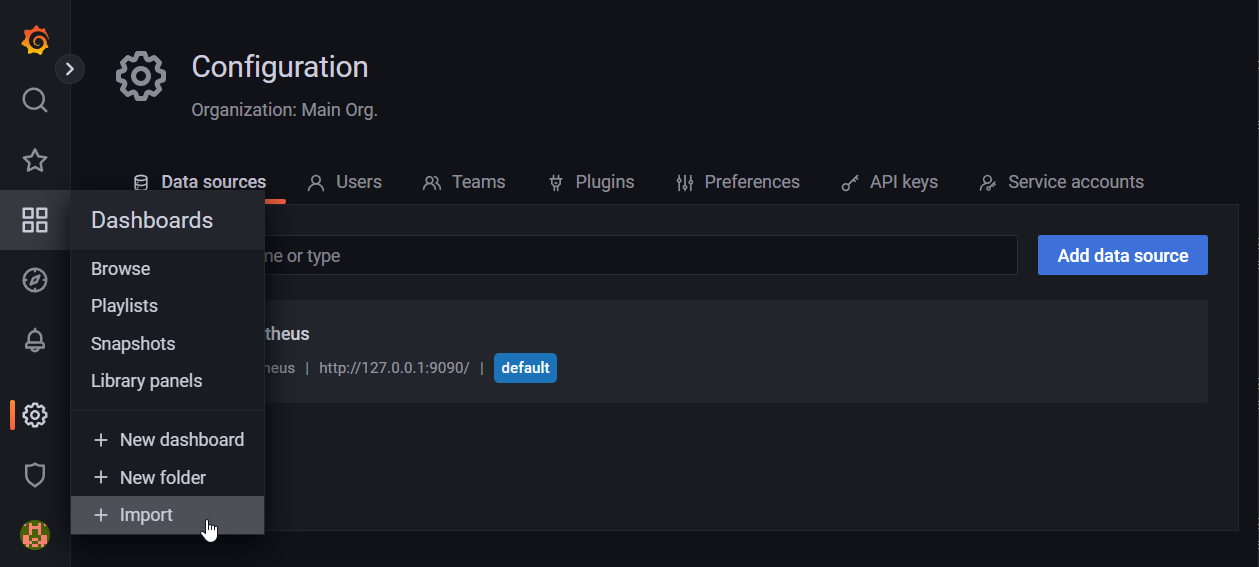
Click on the Import menu option
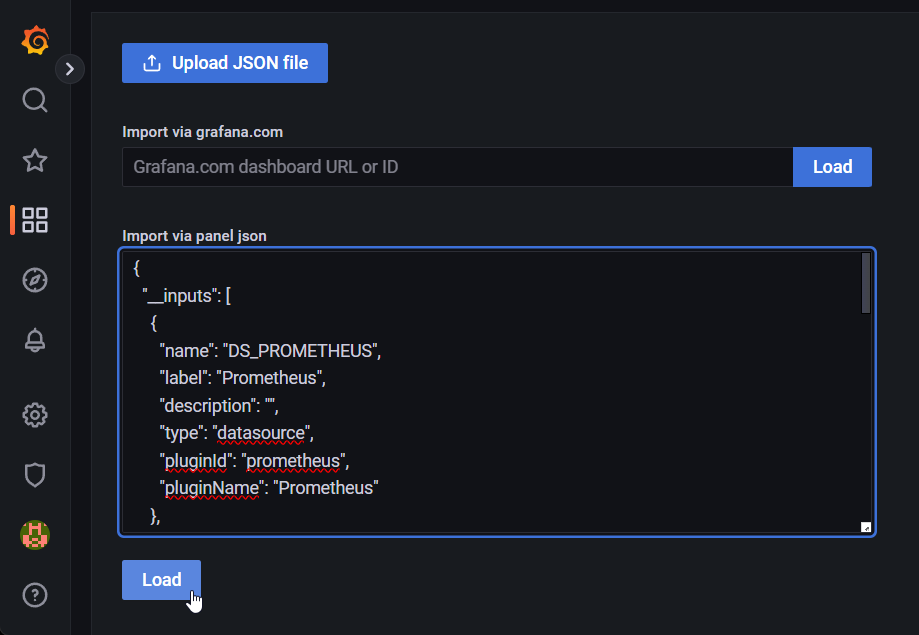
Paste the JSON and click on the Load button
Select the Prometheus data source
Modify the currency variable
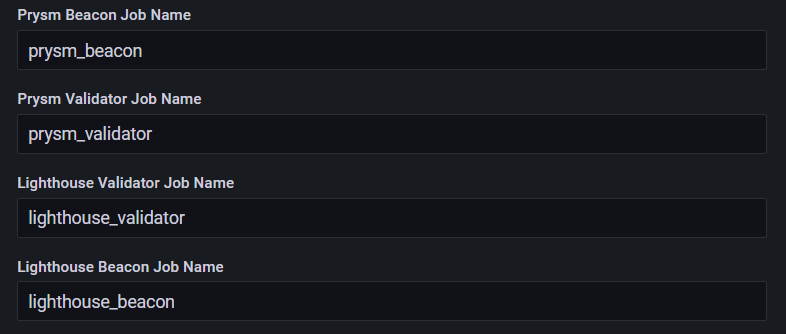
Change Lighthouse and Prysm job names for dashboard compatibility